Tutorial 1: Visium (Triple Negative Breast Cancer)
This tutorial walks through a full Renoir workflow on a 10x Genomics Visium spatial transcriptomics dataset of Triple-Negative Breast Cancer (TNBC). The original dataset comes from Wu et al., Nature Genetics 2021.
Unlike single-cell platforms (e.g., CosMx), Visium captures gene expression at the spot level — each spot covers a small tissue area containing several cells. Renoir handles this by combining the spatial expression matrix (ST) with a matched scRNA-seq reference (SC) and per-spot cell-type proportions (typically from cell2location deconvolution).
By the end of this notebook you will have:
Computed neighborhood communication scores at the spot level.
Visualized ligand–target activity spatially across the tissue section.
Built pathway-level ligand–target clusters from MSigDB.
Identified communication domains via Leiden clustering on the score matrix.
Run differential expression between domains and a ligand-ranking analysis to find drivers of a domain of interest.
Table of Contents
Setup and imports
Compute neighborhood scores
Spatial visualization of a ligand–target pair
Build pathway and de novo ligand–target clusters
Identify communication domains
Visualize communication domains in space
Differential expression between domains
Pathway activity in space
Ligand ranking analysis
Data required to run this tutorial can be found here: https://zenodo.org/records/20078137.
1. Setup and imports
[1]:
import Renoir
import scanpy as sc
import pandas as pd
import numpy as np
import anndata
import pickle
import matplotlib.pyplot as plt

# Make spatial plots a comfortable size by default
plt.rcParams['figure.figsize'] = [8, 8]
2. Compute neighborhood scores
Renoir.compute_neighborhood_scores is the core step of the pipeline. For every spot in the Visium slide, it builds a local neighborhood (default = adjacent Visium spots in the hexagonal grid) and computes a score for each ligand → target gene pair. The score is weighted by the expression of the ligand in neighboring spots, the receptor in the focal spot, and a regulatory-potential prior linking ligand to target.
Key arguments
Argument |
What it is |
|---|---|
|
Path to the matched scRNA-seq reference AnnData. |
|
Path to the spatial (Visium) AnnData. |
|
CSV of pre-selected top ligand–target pairs (here, top 10 ordered by joint optimization). |
|
Curated ligand–receptor pair table (e.g., from NATMI / OmniPath). |
|
Per-spot cell-type proportions from a deconvolution method like cell2location. |
|
Precomputed neighborhood-expression pickle — speeds things up substantially on Visium-scale data. |
Heads-up: this step takes a few minutes. The pandas
FutureWarningyou’ll see in the output below is harmless and comes from upstream pandas API deprecations.Visium-specific note: because Visium is spot-level, we don’t pass
single_cell=True(the default isFalse, matching this case). The neighborhood is the spot’s hexagonal ring — no need to set aradius.
[2]:
neighborhood_scores = Renoir.compute_neighborhood_scores(
    SC_path='/path/to/scRNA.h5ad',
    ST_path='/path/to/ST.h5ad',
    pairs_path='/path/to/top_10_target_opt_both_ordered.csv',
    ligand_receptor_path='/path/to/All_human_lrpairs.csv',
    celltype_proportions_path='/path/to/celltype_proportions.csv',
    expins_path='/path/to/mRNA_subset_new.pkl',
)
/home/nr57/.conda/envs/genomics/lib/python3.11/site-packages/Renoir/renoir.py:74: FutureWarning: The default of observed=False is deprecated and will be changed to True in a future version of pandas. Pass observed=False to retain current behavior or observed=True to adopt the future default and silence this warning.
  mean_sc = mean_sc.groupby('celltype').mean().T.to_dict()
/home/nr57/.conda/envs/genomics/lib/python3.11/site-packages/Renoir/renoir.py:276: RuntimeWarning: divide by zero encountered in log10
  PEM = np.log10(expins/E)
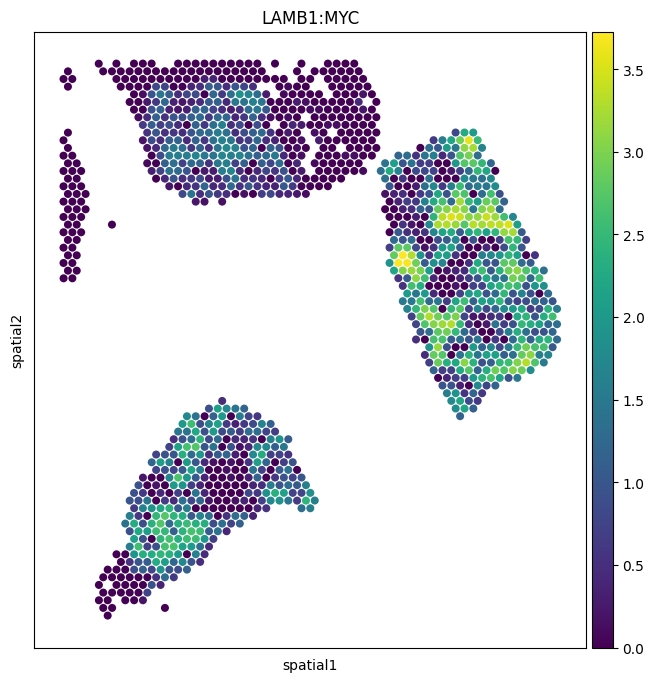
3. Spatial visualization of a ligand–target pair
The simplest exploratory view is a spatial map of one ligand–target pair painted onto the tissue. Below we plot ``LAMB1:MYC`` — laminin subunit beta-1 driving MYC expression — across the slide.
If a pair you care about isn’t in the default top-10 set, you can either edit the ligand–target list passed to
compute_neighborhood_scores, or rerun with a larger top-N file (e.g.,top_100_target_opt_both_ordered.csv).
[3]:
sc.pl.spatial(
    neighborhood_scores,
    img_key="hires",
    color=["LAMB1:MYC"],
    size=1.4,
    alpha_img=0,
)
/tmp/ipykernel_3829508/802394492.py:1: FutureWarning: Use `squidpy.pl.spatial_scatter` instead.
  sc.pl.spatial(neighborhood_scores, img_key="hires", color=["LAMB1:MYC"], size = 1.4, alpha_img=0)
4. Build pathway and de novo ligand–target clusters
Renoir lets you group ligand–target pairs into clusters so you can score whole biological programs at once. Two flavors are supported:
Pathway-based clusters — using a curated gene-set database (e.g., MSigDB Hallmark, KEGG, WikiPathways). Each pathway becomes a cluster of all ligand–target pairs whose target gene is in that set.
De novo clusters — discovered directly from the score matrix, with no prior knowledge required.
Below we use a custom MSigDB CSV combining Hallmark, KEGG, and WikiPathways human gene sets.
[4]:
# Load curated MSigDB pathways (Hallmark + KEGG + WikiPathways, human)
msigh = Renoir.get_msig('custom', path='/path/to/msig_human_WP_H_KEGG_new.csv')

# Build one ligand-target cluster per pathway
pathways = Renoir.create_cluster(
    neighborhood_scores,
    msigh,
    method=None,          # pathway-based only; pass 'leiden' (etc.) to also get de novo clusters
    restrict_to_KHW=True, # keep only KEGG / Hallmark / WikiPathways
)

# Peek at the available pathway names
pathways.keys()
[4]:
dict_keys(['HALLMARK_ALLOGRAFT_REJECTION', 'HALLMARK_APICAL_JUNCTION', 'HALLMARK_APOPTOSIS', 'HALLMARK_COAGULATION', 'HALLMARK_COMPLEMENT', 'HALLMARK_EPITHELIAL_MESENCHYMAL_TRANSITION', 'HALLMARK_ESTROGEN_RESPONSE_LATE', 'HALLMARK_HYPOXIA', 'HALLMARK_IL2_STAT5_SIGNALING', 'HALLMARK_IL6_JAK_STAT3_SIGNALING', 'HALLMARK_INFLAMMATORY_RESPONSE', 'HALLMARK_INTERFERON_GAMMA_RESPONSE', 'HALLMARK_KRAS_SIGNALING_UP', 'HALLMARK_TNFA_SIGNALING_VIA_NFKB', 'HALLMARK_UV_RESPONSE_UP', 'KEGG_ALLOGRAFT_REJECTION', 'KEGG_APOPTOSIS', 'KEGG_AUTOIMMUNE_THYROID_DISEASE', 'KEGG_BLADDER_CANCER', 'KEGG_CELL_ADHESION_MOLECULES_CAMS', 'KEGG_CHEMOKINE_SIGNALING_PATHWAY', 'KEGG_CYTOKINE_CYTOKINE_RECEPTOR_INTERACTION', 'KEGG_ERBB_SIGNALING_PATHWAY', 'KEGG_FOCAL_ADHESION', 'KEGG_GAP_JUNCTION', 'KEGG_GLIOMA', 'KEGG_GRAFT_VERSUS_HOST_DISEASE', 'KEGG_INTESTINAL_IMMUNE_NETWORK_FOR_IGA_PRODUCTION', 'KEGG_JAK_STAT_SIGNALING_PATHWAY', 'KEGG_LEUKOCYTE_TRANSENDOTHELIAL_MIGRATION', 'KEGG_MAPK_SIGNALING_PATHWAY', 'KEGG_MELANOMA', 'KEGG_NATURAL_KILLER_CELL_MEDIATED_CYTOTOXICITY', 'KEGG_NEUROTROPHIN_SIGNALING_PATHWAY', 'KEGG_NOD_LIKE_RECEPTOR_SIGNALING_PATHWAY', 'KEGG_P53_SIGNALING_PATHWAY', 'KEGG_PANCREATIC_CANCER', 'KEGG_PATHWAYS_IN_CANCER', 'KEGG_PROSTATE_CANCER', 'KEGG_REGULATION_OF_ACTIN_CYTOSKELETON', 'KEGG_RENAL_CELL_CARCINOMA', 'KEGG_SMALL_CELL_LUNG_CANCER', 'KEGG_SYSTEMIC_LUPUS_ERYTHEMATOSUS', 'KEGG_TGF_BETA_SIGNALING_PATHWAY', 'KEGG_TOLL_LIKE_RECEPTOR_SIGNALING_PATHWAY', 'KEGG_TYPE_I_DIABETES_MELLITUS', 'KEGG_WNT_SIGNALING_PATHWAY', 'WP_ADIPOGENESIS', 'WP_ALLOGRAFT_REJECTION', 'WP_APOPTOSIS', 'WP_APOPTOSIS_MODULATION_AND_SIGNALING', 'WP_BLADDER_CANCER', 'WP_BRAINDERIVED_NEUROTROPHIC_FACTOR_BDNF_SIGNALING_PATHWAY', 'WP_BREAST_CANCER_PATHWAY', 'WP_BURN_WOUND_HEALING', 'WP_CHEMOKINE_SIGNALING_PATHWAY', 'WP_DEVELOPMENT_AND_HETEROGENEITY_OF_THE_ILC_FAMILY', 'WP_DNA_DAMAGE_RESPONSE_ONLY_ATM_DEPENDENT', 'WP_EGFR_TYROSINE_KINASE_INHIBITOR_RESISTANCE', 'WP_EMBRYONIC_STEM_CELL_PLURIPOTENCY_PATHWAYS', 'WP_ENDOCHONDRAL_OSSIFICATION', 'WP_ENDOCHONDRAL_OSSIFICATION_WITH_SKELETAL_DYSPLASIAS', 'WP_EPITHELIAL_TO_MESENCHYMAL_TRANSITION_IN_COLORECTAL_CANCER', 'WP_ERBB_SIGNALING_PATHWAY', 'WP_FOCAL_ADHESION', 'WP_FOCAL_ADHESION_PI3KAKTMTORSIGNALING_PATHWAY', 'WP_FOLATE_METABOLISM', 'WP_HEPATITIS_B_INFECTION', 'WP_IL18_SIGNALING_PATHWAY', 'WP_IL1_AND_MEGAKARYOCYTES_IN_OBESITY', 'WP_INTERACTIONS_OF_NATURAL_KILLER_CELLS_IN_PANCREATIC_CANCER', 'WP_LNCRNA_IN_CANONICAL_WNT_SIGNALING_AND_COLORECTAL_CANCER', 'WP_LUNG_FIBROSIS', 'WP_MALE_INFERTILITY', 'WP_MALIGNANT_PLEURAL_MESOTHELIOMA', 'WP_MAPK_SIGNALING_PATHWAY', 'WP_MIRNAS_INVOLVEMENT_IN_THE_IMMUNE_RESPONSE_IN_SEPSIS', 'WP_NCRNAS_INVOLVED_IN_WNT_SIGNALING_IN_HEPATOCELLULAR_CARCINOMA', 'WP_NETRINUNC5B_SIGNALING_PATHWAY', 'WP_NETWORK_MAP_OF_SARSCOV2_SIGNALING_PATHWAY', 'WP_NEUROINFLAMMATION_AND_GLUTAMATERGIC_SIGNALING', 'WP_NONALCOHOLIC_FATTY_LIVER_DISEASE', 'WP_NRP1TRIGGERED_SIGNALING_PATHWAYS_IN_PANCREATIC_CANCER', 'WP_NUCLEAR_RECEPTORS_METAPATHWAY', 'WP_ONCOSTATIN_M_SIGNALING_PATHWAY', 'WP_OREXIN_RECEPTOR_PATHWAY', 'WP_OVERVIEW_OF_PROINFLAMMATORY_AND_PROFIBROTIC_MEDIATORS', 'WP_P53_TRANSCRIPTIONAL_GENE_NETWORK', 'WP_PHOTODYNAMIC_THERAPYINDUCED_AP1_SURVIVAL_SIGNALING', 'WP_PHOTODYNAMIC_THERAPYINDUCED_HIF1_SURVIVAL_SIGNALING', 'WP_PHOTODYNAMIC_THERAPYINDUCED_NFKB_SURVIVAL_SIGNALING', 'WP_PI3KAKT_SIGNALING_PATHWAY', 'WP_PLATELETMEDIATED_INTERACTIONS_WITH_VASCULAR_AND_CIRCULATING_CELLS', 'WP_PLURIPOTENT_STEM_CELL_DIFFERENTIATION_PATHWAY', 'WP_PRIMARY_FOCAL_SEGMENTAL_GLOMERULOSCLEROSIS_FSGS', 'WP_PROSTAGLANDIN_SIGNALING', 'WP_RAC1PAK1P38MMP2_PATHWAY', 'WP_REGULATION_OF_ACTIN_CYTOSKELETON', 'WP_SARSCOV2_INNATE_IMMUNITY_EVASION_AND_CELLSPECIFIC_IMMUNE_RESPONSE', 'WP_SELENIUM_MICRONUTRIENT_NETWORK', 'WP_SMALL_CELL_LUNG_CANCER', 'WP_SPINAL_CORD_INJURY', 'WP_SUDDEN_INFANT_DEATH_SYNDROME_SIDS_SUSCEPTIBILITY_PATHWAYS', 'WP_TCELL_ACTIVATION_SARSCOV2', 'WP_TGFBETA_RECEPTOR_SIGNALING', 'WP_TGFBETA_RECEPTOR_SIGNALING_IN_SKELETAL_DYSPLASIAS', 'WP_TGFBETA_SIGNALING_PATHWAY', 'WP_THYMIC_STROMAL_LYMPHOPOIETIN_TSLP_SIGNALING_PATHWAY', 'WP_TNFRELATED_WEAK_INDUCER_OF_APOPTOSIS_TWEAK_SIGNALING_PATHWAY', 'WP_TOLLLIKE_RECEPTOR_SIGNALING_PATHWAY', 'WP_VEGFAVEGFR2_SIGNALING_PATHWAY', 'WP_VITAMIN_B12_METABOLISM', 'WP_VITAMIN_D_RECEPTOR_PATHWAY', 'WP_WNT_SIGNALING'])
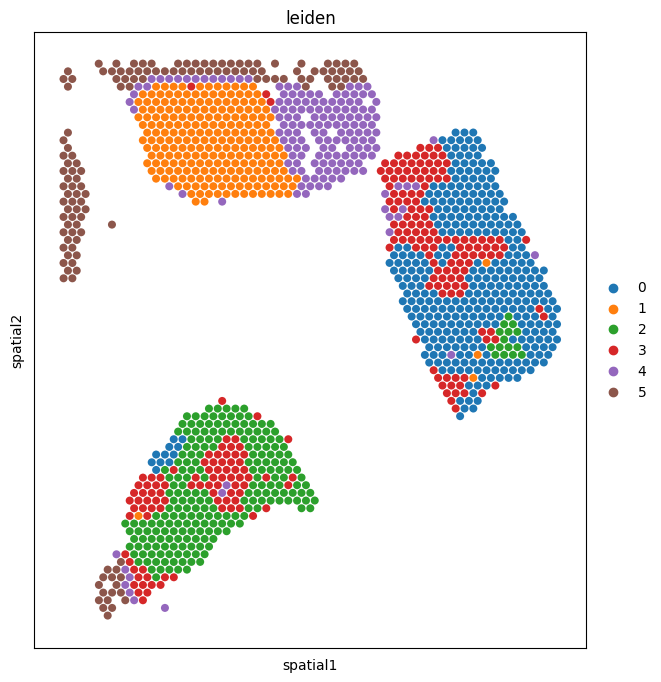
5. Identify communication domains
downstream_analysis returns:
neighbscore_copy— a copy of the AnnData withobs['leiden']populated (one label per spot = its domain).pcs— an AnnData of per-pathway activity scores (used in section 8 below).
Tuning knobs
``resolution=0.6`` — Leiden resolution. Lower → fewer, broader domains; higher → more, finer ones. Visium slides typically use a higher resolution than CosMx because spots are much sparser than single cells.
``n_markers=20`` / ``n_top=20`` — number of top marker pairs per cluster to retain for downstream interpretation.
``pdf_path=None`` — set to a filepath to dump diagnostic plots to PDF.
[5]:
neighbscore_copy, pcs = Renoir.downstream_analysis(
    neighborhood_scores,
    ltpair_clusters=pathways,
    resolution=0.6,
    n_markers=20,
    n_top=20,
    pdf_path=None,
    return_cluster=True,
    return_pcs=True,
)
/home/nr57/.conda/envs/genomics/lib/python3.11/site-packages/Renoir/downstream.py:182: FutureWarning: DataFrame.applymap has been deprecated. Use DataFrame.map instead.
  pcs = pcs.applymap(abs)
/home/nr57/.conda/envs/genomics/lib/python3.11/site-packages/scipy/sparse/_index.py:145: SparseEfficiencyWarning: Changing the sparsity structure of a csr_matrix is expensive. lil_matrix is more efficient.
  self._set_arrayXarray(i, j, x)
/home/nr57/.conda/envs/genomics/lib/python3.11/site-packages/tqdm/auto.py:21: TqdmWarning: IProgress not found. Please update jupyter and ipywidgets. See https://ipywidgets.readthedocs.io/en/stable/user_install.html
  from .autonotebook import tqdm as notebook_tqdm
/home/nr57/.conda/envs/genomics/lib/python3.11/site-packages/Renoir/downstream.py:227: FutureWarning: In the future, the default backend for leiden will be igraph instead of leidenalg.

 To achieve the future defaults please pass: flavor="igraph" and n_iterations=2.  directed must also be False to work with igraph's implementation.
  sc.tl.leiden(neighbscore_copy, resolution=resolution)
6. Visualize communication domains in space
[6]:
sc.pl.spatial(
    neighbscore_copy,
    img_key="hires",
    color=["leiden"],
    size=1.4,
    alpha_img=0,
)
/tmp/ipykernel_3829508/3103730653.py:1: FutureWarning: Use `squidpy.pl.spatial_scatter` instead.
  sc.pl.spatial(neighbscore_copy, img_key="hires", color=["leiden"], size=1.4, alpha_img=0)
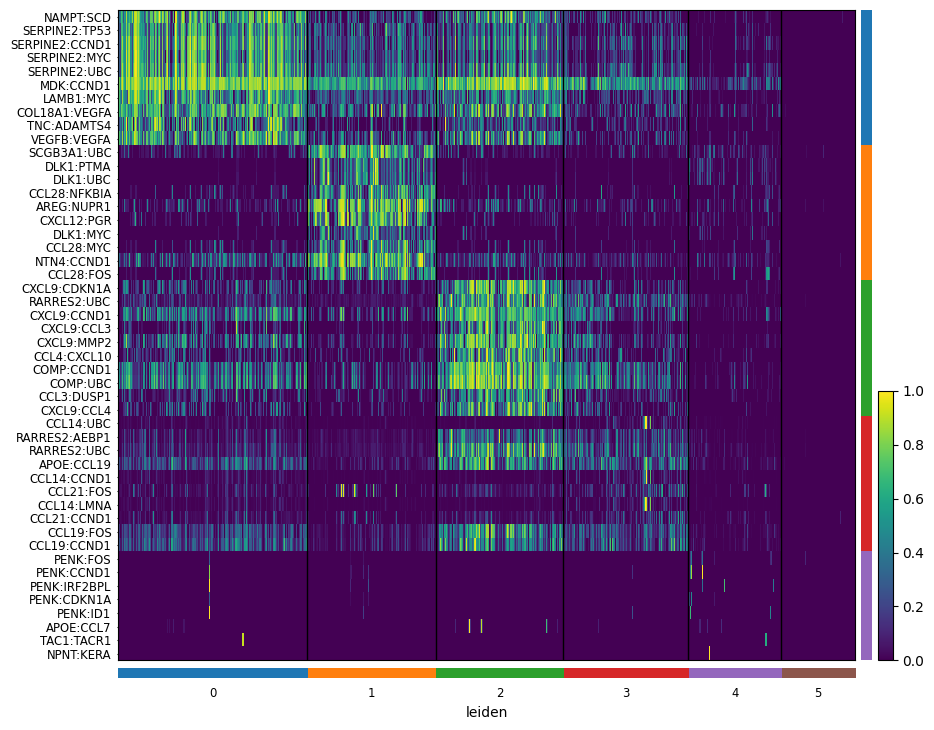
7. Differential expression between domains
[7]:
# Carry the domain labels back to the original score AnnData
neighborhood_scores.obs['leiden'] = neighbscore_copy.obs['leiden']
neighborhood_scores.uns = neighbscore_copy.uns
[8]:
# One-vs-rest Wilcoxon ranking of ligand-target pairs per domain
sc.tl.rank_genes_groups(neighborhood_scores, "leiden", method="wilcoxon")

# Heatmap of the top-10 pairs per domain
sc.pl.rank_genes_groups_heatmap(
    neighborhood_scores,
    n_genes=10,
    groupby="leiden",
    show_gene_labels=True,
    min_logfoldchange=0.5,
    dendrogram=False,
    swap_axes=True,
    standard_scale='var',
    cmap='viridis',
)
WARNING: No genes found for group 5
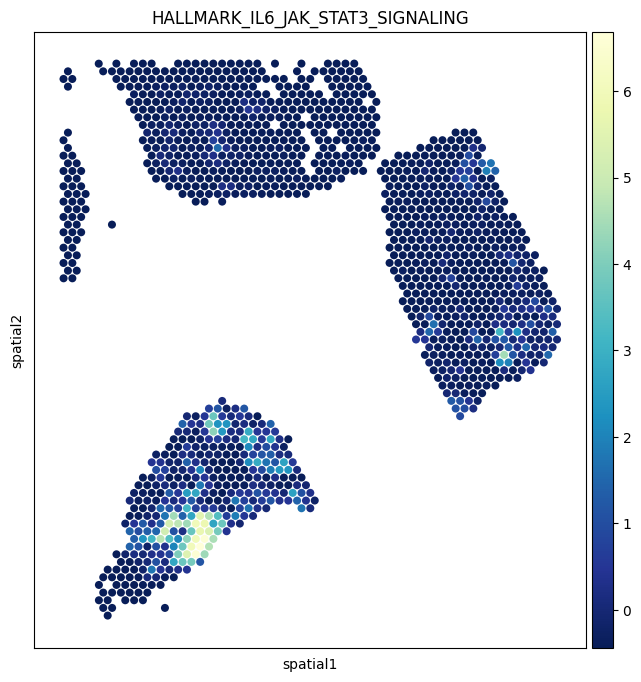
8. Pathway activity in space
The pcs AnnData returned by downstream_analysis holds a per-spot activity score for every pathway cluster. Painting one of these onto the tissue is often more interpretable than a single ligand–target pair, because it summarizes a whole biological program.
Below we visualize HALLMARK_IL6_JAK_STAT3_SIGNALING — a canonical inflammatory pathway active in many tumors, including TNBC. Bright regions = areas where IL6/JAK/STAT3 signaling activity is predicted from the neighborhood.
[9]:
sc.pl.spatial(
    pcs,
    img_key="hires",
    color=['HALLMARK_IL6_JAK_STAT3_SIGNALING'],
    size=1.4,
    alpha_img=0,
    cmap='YlGnBu_r',
)
/tmp/ipykernel_3829508/2273691165.py:1: FutureWarning: Use `squidpy.pl.spatial_scatter` instead.
  sc.pl.spatial(pcs, img_key="hires", color=['HALLMARK_IL6_JAK_STAT3_SIGNALING'], size = 1.4, alpha_img=0, cmap='YlGnBu_r')
9. Ligand ranking analysis
Inputs needed:
celltype— AnnData with cell-type proportions per spot (the cell2location output).ligand_receptor_pairs— curated L–R table (here, from NATMI).ligand_target_regulatory_potential— a precomputed pickle of ligand → top-500 target regulatory scores.SC— the matched scRNA-seq reference (used to measure receptor expression in each cell type).celltype_colors— a custom palette so cell types render with consistent, distinguishable colors across plots.
We also stash a copy of neighborhood_scores into .raw so the ranking function can recover the unmodified scores after the DE step above.
[10]:
# Cell-type proportions per spot (from cell2location)
celltype = sc.read_h5ad('/path/to/celltype.h5ad')

# Curated NATMI ligand-receptor table
ligand_receptor_pairs = pd.read_csv('/path/to/NATMI_ligand_receptor_pairs.csv')

# Precomputed ligand -> top-500 target regulatory potentials
ligand_target_regulatory_potential = pickle.load(
    open('/path/to/top_500_target_opt_both_scores.pkl', 'rb')
)

# Custom palette so cell-type colors stay consistent across plots
celltype_colors = {
    'Cancer Basal SC':      '#4a6e45',
    'Cancer Cycling':       '#8727a8',
    'T cells CD4+':         '#f19bf6',
    'CAFs myCAF-like':      '#919225',
    'T cells CD8+':         '#861c1c',
    'PVL Differentiated':   '#cc9900',
    'CAFs MSC iCAF-like':   '#0099ff',
    'Luminal Progenitors':  '#b12a55',
    'Mature Luminal':       '#906e1f',
    'Myoepithelial':        '#a48cf4',
    'Endothelial ACKR1':    '#f45cf2',
    'Macrophage':           '#f66bad',
    'Plasmablasts':         '#ffff00',
}

# Matched scRNA-seq reference (used to measure receptor expression per cell type)
SC = sc.read_h5ad('/path/to/scRNA.h5ad')

# Stash the score matrix so ligand_ranking can reach the raw values
neighborhood_scores.raw = neighborhood_scores.copy()
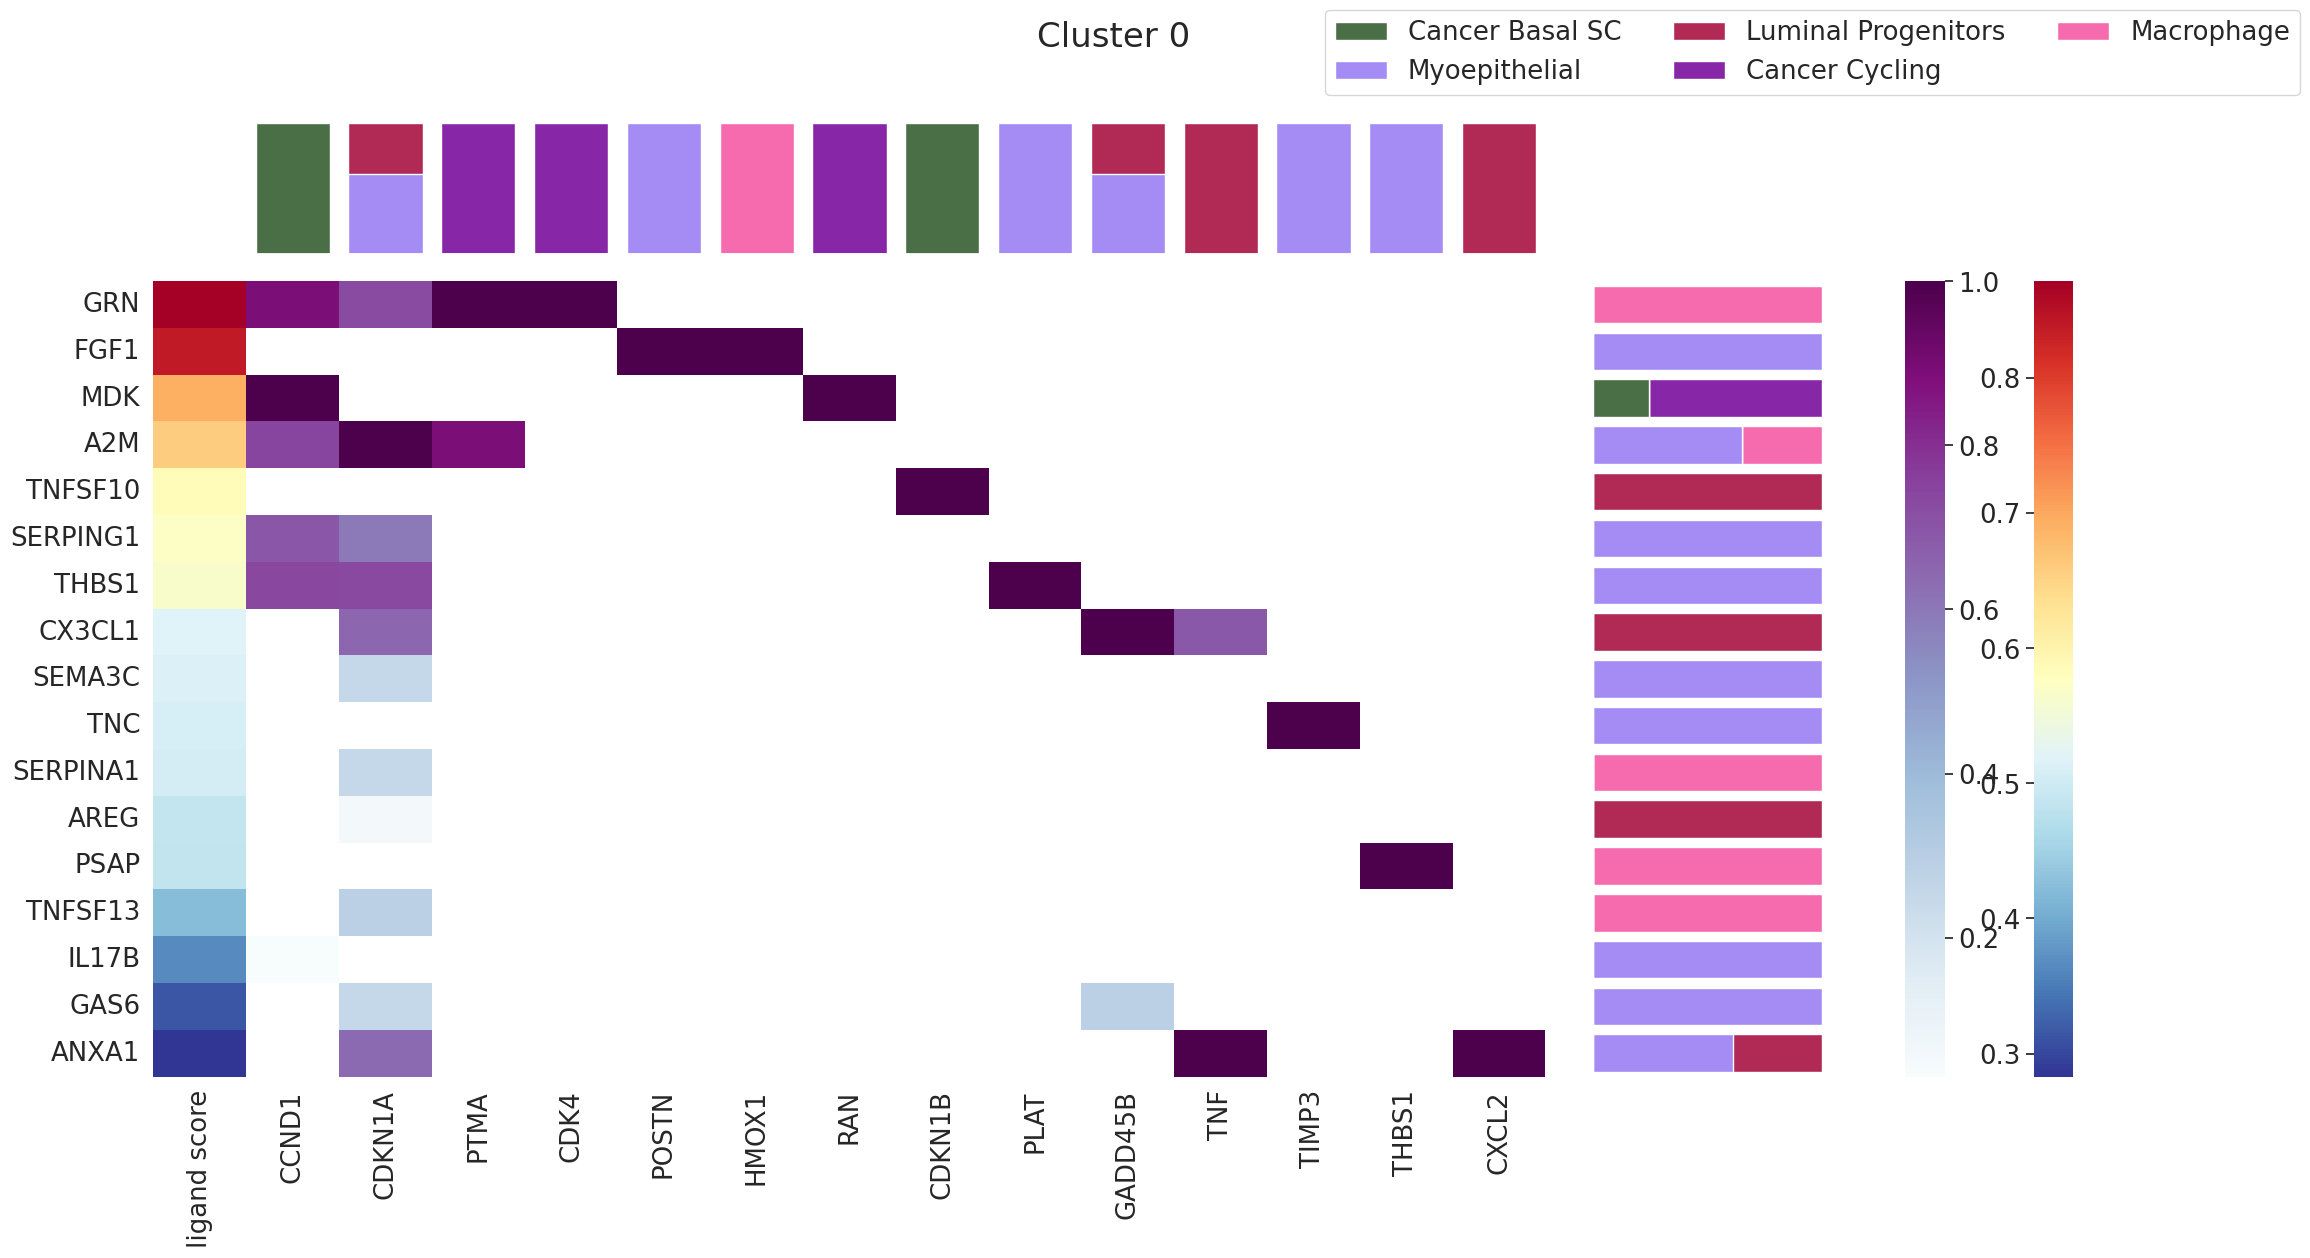
Run the ranking for domain '0'
The arguments below say:
'0'— rank ligands for communication domain 0 (change to whichever domain you’re investigating).receptor_exp=0.05— keep only ligands whose receptor is expressed in at least 5% of spots in the domain. Filters out ligands the domain literally can’t sense.markers={'top': 100}— use the top 100 marker ligand–target pairs of the domain to score each ligand.domain_celltypes=['top', 5]— restrict the analysis to the top 5 cell types by abundance in the domain.celltype_colors=celltype_colors— use the custom palette defined above.
The output is a multi-panel figure: ligand ranking, expressing cell types, and the spatial location of the domain. Repeat with different domain IDs ('1', '2', …) to characterize the entire tissue.
[16]:
fig = Renoir.ligand_ranking(
    neighborhood_scores,
    celltype,
    SC,
    ligand_receptor_pairs,
    ligand_target_regulatory_potential,
    '0',                          # target domain ID
    receptor_exp=0.05,            # min receptor-expressing fraction
    markers={'top': 100},         # top-100 marker pairs as the ranking signal
    domain_celltypes=['top', 5],  # restrict to top-5 cell types in the domain
    celltype_colors=celltype_colors,
)
fig.set_size_inches(24, 12)
fig
WARNING: It seems you use rank_genes_groups on the raw count data. Please logarithmize your data before calling rank_genes_groups.
/home/nr57/.conda/envs/genomics/lib/python3.11/site-packages/Renoir/downstream.py:881: FutureWarning: Setting an item of incompatible dtype is deprecated and will raise an error in a future version of pandas. Value '0.1448754370212555' has dtype incompatible with int64, please explicitly cast to a compatible dtype first.
  ct_bar_plot.loc[row,col] = celltype_avg[domain][col]
/home/nr57/.conda/envs/genomics/lib/python3.11/site-packages/Renoir/downstream.py:881: FutureWarning: Setting an item of incompatible dtype is deprecated and will raise an error in a future version of pandas. Value '0.0755910575389862' has dtype incompatible with int64, please explicitly cast to a compatible dtype first.
  ct_bar_plot.loc[row,col] = celltype_avg[domain][col]
/home/nr57/.conda/envs/genomics/lib/python3.11/site-packages/Renoir/downstream.py:881: FutureWarning: Setting an item of incompatible dtype is deprecated and will raise an error in a future version of pandas. Value '0.04784858226776123' has dtype incompatible with int64, please explicitly cast to a compatible dtype first.
  ct_bar_plot.loc[row,col] = celltype_avg[domain][col]
/home/nr57/.conda/envs/genomics/lib/python3.11/site-packages/Renoir/downstream.py:881: FutureWarning: Setting an item of incompatible dtype is deprecated and will raise an error in a future version of pandas. Value '0.4545815587043762' has dtype incompatible with int64, please explicitly cast to a compatible dtype first.
  ct_bar_plot.loc[row,col] = celltype_avg[domain][col]
/home/nr57/.conda/envs/genomics/lib/python3.11/site-packages/Renoir/downstream.py:881: FutureWarning: Setting an item of incompatible dtype is deprecated and will raise an error in a future version of pandas. Value '0.04091129079461098' has dtype incompatible with int64, please explicitly cast to a compatible dtype first.
  ct_bar_plot.loc[row,col] = celltype_avg[domain][col]
/home/nr57/.conda/envs/genomics/lib/python3.11/site-packages/Renoir/downstream.py:894: FutureWarning: Setting an item of incompatible dtype is deprecated and will raise an error in a future version of pandas. Value '0.1448754370212555' has dtype incompatible with int64, please explicitly cast to a compatible dtype first.
  ct_bar_plot.loc[row,col] = celltype_avg[domain][col]
/home/nr57/.conda/envs/genomics/lib/python3.11/site-packages/Renoir/downstream.py:894: FutureWarning: Setting an item of incompatible dtype is deprecated and will raise an error in a future version of pandas. Value '0.0755910575389862' has dtype incompatible with int64, please explicitly cast to a compatible dtype first.
  ct_bar_plot.loc[row,col] = celltype_avg[domain][col]
/home/nr57/.conda/envs/genomics/lib/python3.11/site-packages/Renoir/downstream.py:894: FutureWarning: Setting an item of incompatible dtype is deprecated and will raise an error in a future version of pandas. Value '0.04784858226776123' has dtype incompatible with int64, please explicitly cast to a compatible dtype first.
  ct_bar_plot.loc[row,col] = celltype_avg[domain][col]
/home/nr57/.conda/envs/genomics/lib/python3.11/site-packages/Renoir/downstream.py:894: FutureWarning: Setting an item of incompatible dtype is deprecated and will raise an error in a future version of pandas. Value '0.4545815587043762' has dtype incompatible with int64, please explicitly cast to a compatible dtype first.
  ct_bar_plot.loc[row,col] = celltype_avg[domain][col]
/home/nr57/.conda/envs/genomics/lib/python3.11/site-packages/Renoir/downstream.py:894: FutureWarning: Setting an item of incompatible dtype is deprecated and will raise an error in a future version of pandas. Value '0.04091129079461098' has dtype incompatible with int64, please explicitly cast to a compatible dtype first.
  ct_bar_plot.loc[row,col] = celltype_avg[domain][col]
[16]: