Tutorial 2: CosMX (Hepatocellular Carcinoma)
This tutorial walks through a full Renoir workflow for analyzing cell-cell communication in a CosMx Spatial Molecular Imager (SMI) dataset of hepatocellular carcinoma (HCC). By the end, you will have:
Computed neighborhood communication scores at single-cell resolution.
Visualized ligand–target activity spatially across tissue fields of view (FOVs).
Built pathway-level and de novo ligand–target clusters.
Identified communication domains via Leiden clustering on the score matrix.
Run differential expression between domains and a ligand-ranking analysis to find drivers of a domain of interest.
Contents
Setup and imports
Compute neighborhood scores
Inspect and clean the score object
Spatial visualization of ligand–target activity
Build pathway and de novo ligand–target clusters
Identify communication domains
Visualize domains and pathway activity
Differential expression between domains
Pathway activity in space
Ligand ranking analysis
Data required to run this tutorial can be found here: https://zenodo.org/records/20078137.
1. Setup and imports
[1]:
import Renoir
import scanpy as sc
import squidpy as sq
import pandas as pd
import pickle as pkl
2. Compute neighborhood scores
Key arguments
Argument |
What it is |
|---|---|
|
Path to the single-cell / spatial AnnData ( |
|
CSV of pre-selected top ligand–target pairs (here, the top 100 ordered by joint optimization). |
|
Curated ligand–receptor pair table (e.g., from NATMI / OmniPath). |
|
Per-cell (or per-spot) cell-type proportions. |
|
Precomputed neighborhood-expression pickle — speeds things up substantially on large datasets. |
|
Run in single-cell mode (vs. spot-level for Visium-like data). |
|
Neighborhood radius in the same units as the spatial coordinates (microns for CosMx). 198 μm is a reasonable mid-range for HCC tissue. |
The call returns an AnnData whose .X is the cell × ligand-target score matrix.
Caution: this step is expensive on full datasets (> 500000 spots with > 10000 genes). Expect a few minutes to tens of minutes depending on cell count and pair count.
[2]:
neighborhood_scores = Renoir.compute_neighborhood_scores(
    SC_path='/path/to/cell_level.h5ad',
    ST_path='/path/to/cell_level.h5ad',
    pairs_path='/path/to/top_100_target_opt_both_ordered.csv',
    ligand_receptor_path='/path/to/All_human_lrpairs.csv',
    celltype_proportions_path='/path/to/celltype_prop_cell_level.csv',
    expins_path='/path/to/mRNA_subset_cell_level.pkl',
    single_cell=True,
    radius=198,
)
/home/nr57/.conda/envs/genomics/lib/python3.11/site-packages/Renoir/renoir.py:74: FutureWarning: The default of observed=False is deprecated and will be changed to True in a future version of pandas. Pass observed=False to retain current behavior or observed=True to adopt the future default and silence this warning.
  mean_sc = mean_sc.groupby('celltype').mean().T.to_dict()
/home/nr57/.conda/envs/genomics/lib/python3.11/site-packages/Renoir/renoir.py:276: RuntimeWarning: invalid value encountered in divide
  PEM = np.log10(expins/E)
/home/nr57/.conda/envs/genomics/lib/python3.11/site-packages/Renoir/renoir.py:276: RuntimeWarning: divide by zero encountered in log10
  PEM = np.log10(expins/E)
3. Inspect and clean the score object
You should see roughly N cells × N ligand-target pairs and the standard CosMx .obs fields.
[3]:
neighborhood_scores
[3]:
AnnData object with n_obs × n_vars = 70166 × 5424
    obs: 'orig.ident', 'nCount_Nanostring', 'nFeature_Nanostring', 'cell_ID', 'fov', 'Area', 'AspectRatio', 'Width', 'Height', 'Mean.CD298', 'Max.CD298', 'Mean.PanCK', 'Max.PanCK', 'Mean.CD45', 'Max.CD45', 'Mean.CD3', 'Max.CD3', 'Mean.DAPI', 'Max.DAPI', 'dualfiles', 'Run_name', 'Slide_name', 'ISH.concentration', 'Dash', 'tissue', 'slide_ID_numeric', 'Run_Tissue_name', 'Panel', 'Diversity', 'totalcounts', 'log10totalcounts', 'background', 'remove_flagged_cells', 'IFcolor', 'L1', 'L2', 'OF', 'array_row', 'array_col', 'celltype'
    var: 'gene_ids'
    uns: 'spatial'
    obsm: 'spatial', 'spatial_fov'
[4]:
#The fix below is purely cosmetic — it doesn't change any scores — but it prevents downstream plotting errors. Skip it if your data already has the right dtypes.

# Coerce `fov` to a categorical string so squidpy can use it as a library key
neighborhood_scores.obs['fov'] = neighborhood_scores.obs['fov'].astype('str')
neighborhood_scores.obs['fov'] = neighborhood_scores.obs['fov'].astype('category')

# `cell_ID` originally looks like 'c_1_10_42' — we just want the trailing integer (42)
# so it lines up with the segmentation mask labels squidpy reads.
neighborhood_scores.obs['cell_ID'] = [int(x.split('_')[3]) for x in neighborhood_scores.obs['cell_ID']]
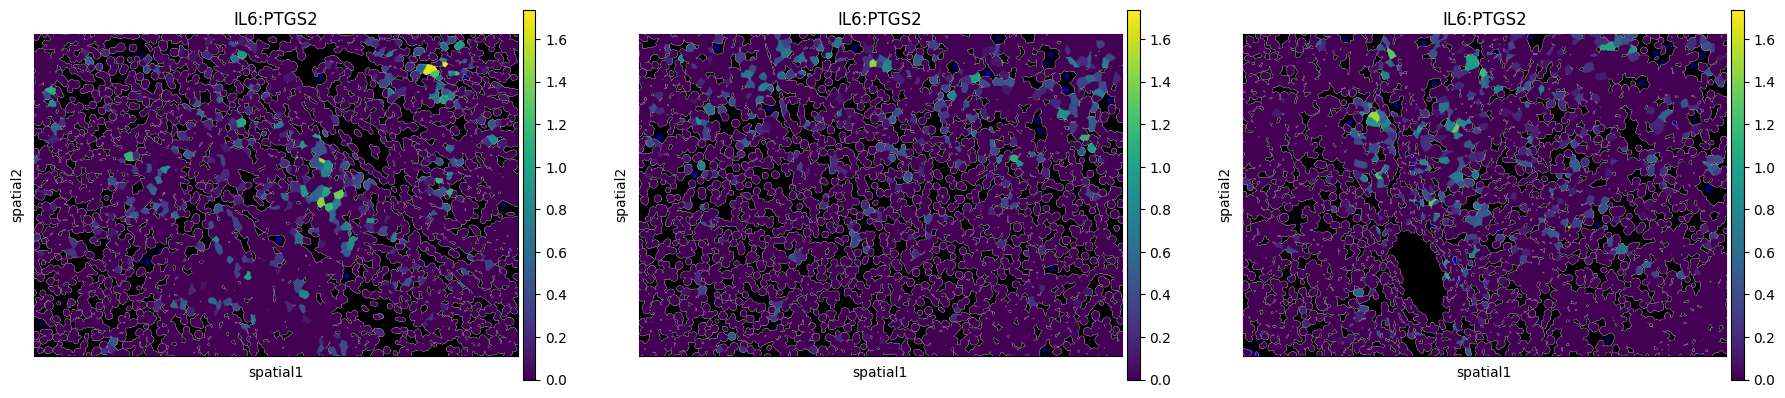
4. Spatial visualization of ligand–target activity
With scores in hand, the simplest exploratory view is a spatial map of one ligand–target pair, painted onto the cell segmentation. Below we plot ``IL6:PTGS2`` across FOVs 10, 11, and 12.
[5]:
sq.pl.spatial_segment(
    neighborhood_scores,
    color='IL6:PTGS2',
    library_key="fov",
    library_id=['10', '11', '12'],
    seg_cell_id="cell_ID",
)
5. Build pathway and de novo ligand–target clusters
Renoir lets you group ligand–target pairs into clusters so you can score whole biological programs at once. Two flavors are supported:
Pathway-based clusters — using a curated gene-set database (e.g., MSigDB Hallmark, KEGG, WikiPathways). Each pathway becomes a cluster of all ligand–target pairs whose target gene is in that set.
De novo clusters — discovered directly from the score matrix (no prior knowledge required but expensive).
[10]:
# Load curated MSigDB pathways (Hallmark + KEGG + WikiPathways, human)
msigh = Renoir.get_msig('custom', path='/path/to/msig_human_WP_H_KEGG_new.csv')

# Build one ligand-target cluster per pathway
pathways = Renoir.create_cluster(
    neighborhood_scores,
    msigh,
    method=None,          # pathway-based only; set 'leiden' (etc.) to also get de novo clusters
    restrict_to_KHW=True, # keep only KEGG / Hallmark / WikiPathways
)

# Peek at the available pathway names
pathways.keys()
[10]:
dict_keys(['HALLMARK_ALLOGRAFT_REJECTION', 'HALLMARK_APICAL_JUNCTION', 'HALLMARK_APOPTOSIS', 'HALLMARK_COAGULATION', 'HALLMARK_EPITHELIAL_MESENCHYMAL_TRANSITION', 'HALLMARK_IL2_STAT5_SIGNALING', 'HALLMARK_IL6_JAK_STAT3_SIGNALING', 'HALLMARK_INFLAMMATORY_RESPONSE', 'HALLMARK_INTERFERON_GAMMA_RESPONSE', 'HALLMARK_KRAS_SIGNALING_UP', 'HALLMARK_TNFA_SIGNALING_VIA_NFKB', 'KEGG_ALLOGRAFT_REJECTION', 'KEGG_APOPTOSIS', 'KEGG_AUTOIMMUNE_THYROID_DISEASE', 'KEGG_BLADDER_CANCER', 'KEGG_CHEMOKINE_SIGNALING_PATHWAY', 'KEGG_CYTOKINE_CYTOKINE_RECEPTOR_INTERACTION', 'KEGG_CYTOSOLIC_DNA_SENSING_PATHWAY', 'KEGG_ERBB_SIGNALING_PATHWAY', 'KEGG_FOCAL_ADHESION', 'KEGG_GAP_JUNCTION', 'KEGG_GLIOMA', 'KEGG_GRAFT_VERSUS_HOST_DISEASE', 'KEGG_HEMATOPOIETIC_CELL_LINEAGE', 'KEGG_INTESTINAL_IMMUNE_NETWORK_FOR_IGA_PRODUCTION', 'KEGG_JAK_STAT_SIGNALING_PATHWAY', 'KEGG_MAPK_SIGNALING_PATHWAY', 'KEGG_MELANOMA', 'KEGG_NOD_LIKE_RECEPTOR_SIGNALING_PATHWAY', 'KEGG_PANCREATIC_CANCER', 'KEGG_PATHWAYS_IN_CANCER', 'KEGG_PROSTATE_CANCER', 'KEGG_REGULATION_OF_ACTIN_CYTOSKELETON', 'KEGG_RENAL_CELL_CARCINOMA', 'KEGG_SYSTEMIC_LUPUS_ERYTHEMATOSUS', 'KEGG_TOLL_LIKE_RECEPTOR_SIGNALING_PATHWAY', 'KEGG_TYPE_I_DIABETES_MELLITUS', 'KEGG_WNT_SIGNALING_PATHWAY', 'WP_ACUTE_VIRAL_MYOCARDITIS', 'WP_ALLOGRAFT_REJECTION', 'WP_APOPTOSIS', 'WP_APOPTOSIS_MODULATION_AND_SIGNALING', 'WP_BLADDER_CANCER', 'WP_BREAST_CANCER_PATHWAY', 'WP_BURN_WOUND_HEALING', 'WP_CCL18_SIGNALING_PATHWAY', 'WP_CHEMOKINE_SIGNALING_PATHWAY', 'WP_CYTOKINES_AND_INFLAMMATORY_RESPONSE', 'WP_CYTOSOLIC_DNASENSING_PATHWAY', 'WP_DEVELOPMENT_AND_HETEROGENEITY_OF_THE_ILC_FAMILY', 'WP_DNA_DAMAGE_RESPONSE_ONLY_ATM_DEPENDENT', 'WP_EGFR_TYROSINE_KINASE_INHIBITOR_RESISTANCE', 'WP_EMBRYONIC_STEM_CELL_PLURIPOTENCY_PATHWAYS', 'WP_EPITHELIAL_TO_MESENCHYMAL_TRANSITION_IN_COLORECTAL_CANCER', 'WP_ERBB_SIGNALING_PATHWAY', 'WP_FIBRIN_COMPLEMENT_RECEPTOR_3_SIGNALING_PATHWAY', 'WP_FOCAL_ADHESION', 'WP_FOCAL_ADHESION_PI3KAKTMTORSIGNALING_PATHWAY', 'WP_FOLATE_METABOLISM', 'WP_HEPATITIS_B_INFECTION', 'WP_IL18_SIGNALING_PATHWAY', 'WP_IL1_AND_MEGAKARYOCYTES_IN_OBESITY', 'WP_INFLAMMATORY_RESPONSE_PATHWAY', 'WP_INTERACTIONS_OF_NATURAL_KILLER_CELLS_IN_PANCREATIC_CANCER', 'WP_LNCRNA_IN_CANONICAL_WNT_SIGNALING_AND_COLORECTAL_CANCER', 'WP_LUNG_FIBROSIS', 'WP_MALIGNANT_PLEURAL_MESOTHELIOMA', 'WP_MAPK_SIGNALING_PATHWAY', 'WP_MEASLES_VIRUS_INFECTION', 'WP_MIRNAS_INVOLVEMENT_IN_THE_IMMUNE_RESPONSE_IN_SEPSIS', 'WP_NCRNAS_INVOLVED_IN_WNT_SIGNALING_IN_HEPATOCELLULAR_CARCINOMA', 'WP_NETWORK_MAP_OF_SARSCOV2_SIGNALING_PATHWAY', 'WP_NEUROINFLAMMATION_AND_GLUTAMATERGIC_SIGNALING', 'WP_NONALCOHOLIC_FATTY_LIVER_DISEASE', 'WP_NRP1TRIGGERED_SIGNALING_PATHWAYS_IN_PANCREATIC_CANCER', 'WP_NUCLEAR_RECEPTORS_METAPATHWAY', 'WP_OREXIN_RECEPTOR_PATHWAY', 'WP_OSTEOBLAST_DIFFERENTIATION_AND_RELATED_DISEASES', 'WP_OVERVIEW_OF_PROINFLAMMATORY_AND_PROFIBROTIC_MEDIATORS', 'WP_P53_TRANSCRIPTIONAL_GENE_NETWORK', 'WP_PHOTODYNAMIC_THERAPYINDUCED_AP1_SURVIVAL_SIGNALING', 'WP_PHOTODYNAMIC_THERAPYINDUCED_NFKB_SURVIVAL_SIGNALING', 'WP_PI3KAKT_SIGNALING_PATHWAY', 'WP_PLATELETMEDIATED_INTERACTIONS_WITH_VASCULAR_AND_CIRCULATING_CELLS', 'WP_PLURIPOTENT_STEM_CELL_DIFFERENTIATION_PATHWAY', 'WP_PROSTAGLANDIN_SIGNALING', 'WP_RAC1PAK1P38MMP2_PATHWAY', 'WP_REGULATION_OF_ACTIN_CYTOSKELETON', 'WP_SARSCOV2_INNATE_IMMUNITY_EVASION_AND_CELLSPECIFIC_IMMUNE_RESPONSE', 'WP_SELECTIVE_EXPRESSION_OF_CHEMOKINE_RECEPTORS_DURING_TCELL_POLARIZATION', 'WP_SELENIUM_MICRONUTRIENT_NETWORK', 'WP_SPINAL_CORD_INJURY', 'WP_SUDDEN_INFANT_DEATH_SYNDROME_SIDS_SUSCEPTIBILITY_PATHWAYS', 'WP_TCELL_ACTIVATION_SARSCOV2', 'WP_TGFBETA_SIGNALING_PATHWAY', 'WP_TOLLLIKE_RECEPTOR_SIGNALING_PATHWAY', 'WP_TYPE_II_INTERFERON_SIGNALING_IFNG', 'WP_VEGFAVEGFR2_SIGNALING_PATHWAY', 'WP_VITAMIN_B12_METABOLISM', 'WP_WNT_SIGNALING', 'WP_WNT_SIGNALING_PATHWAY_AND_PLURIPOTENCY'])
6. Identify communication domains
downstream_analysis returns:
neighbscore_copy— a copy of the AnnData withobs['leiden']populated (one label per cell = its domain).pcs— an AnnData of per-pathway activity scores (used in section 9 below).
Tuning knobs
``resolution=0.1`` — Leiden resolution. Lower → fewer, broader domains; higher → more, finer ones.
``n_markers=20`` / ``n_top=20`` — number of top marker pairs per cluster to retain for downstream interpretation.
``pdf_path=None`` — set to a filepath to dump diagnostic plots to PDF.
[11]:
neighbscore_copy, pcs = Renoir.downstream_analysis(
    neighborhood_scores,
    ltpair_clusters=pathways,
    resolution=0.1,
    n_markers=20,
    n_top=20,
    pdf_path=None,
    return_cluster=True,
    return_pcs=True,
)
/home/nr57/.conda/envs/genomics/lib/python3.11/site-packages/Renoir/downstream.py:182: FutureWarning: DataFrame.applymap has been deprecated. Use DataFrame.map instead.
  pcs = pcs.applymap(abs)
/home/nr57/.conda/envs/genomics/lib/python3.11/site-packages/scipy/sparse/_index.py:145: SparseEfficiencyWarning: Changing the sparsity structure of a csr_matrix is expensive. lil_matrix is more efficient.
  self._set_arrayXarray(i, j, x)
/home/nr57/.conda/envs/genomics/lib/python3.11/site-packages/tqdm/auto.py:21: TqdmWarning: IProgress not found. Please update jupyter and ipywidgets. See https://ipywidgets.readthedocs.io/en/stable/user_install.html
  from .autonotebook import tqdm as notebook_tqdm
/home/nr57/.conda/envs/genomics/lib/python3.11/site-packages/Renoir/downstream.py:227: FutureWarning: In the future, the default backend for leiden will be igraph instead of leidenalg.

 To achieve the future defaults please pass: flavor="igraph" and n_iterations=2.  directed must also be False to work with igraph's implementation.
  sc.tl.leiden(neighbscore_copy, resolution=resolution)
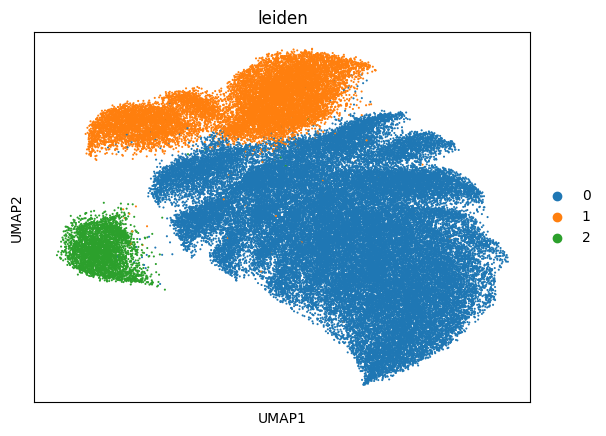
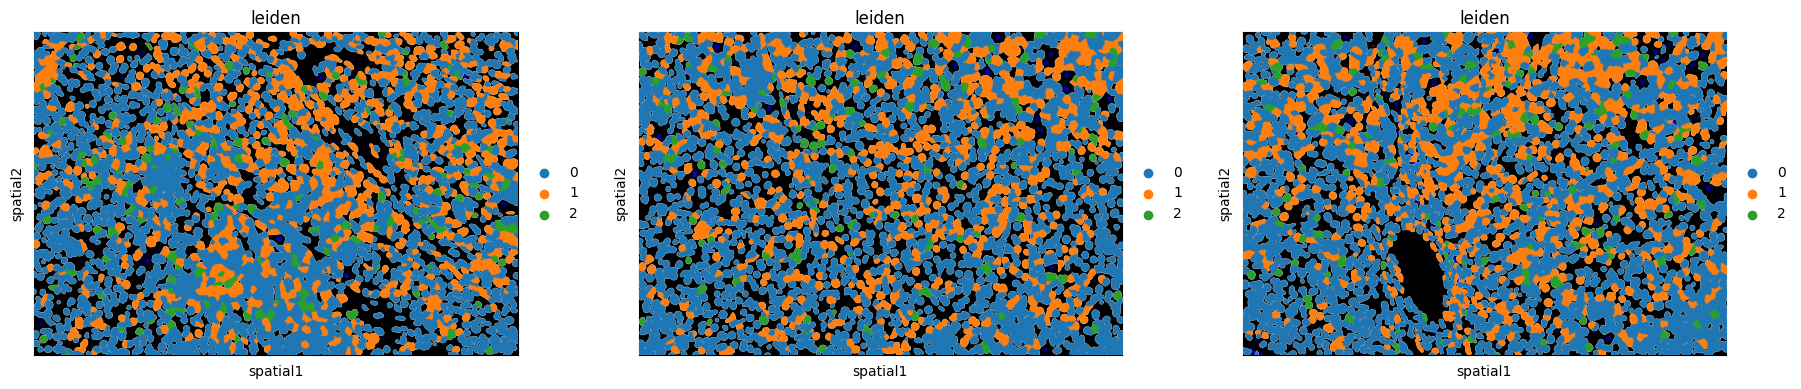
7. Visualize domains and pathway activity
[12]:
# UMAP colored by communication-domain assignment
sc.pl.umap(neighbscore_copy, components='all', color='leiden', size=9)

# The same domain labels mapped back onto the tissue
sq.pl.spatial_segment(
    neighborhood_scores,
    color='leiden',
    library_key="fov",
    library_id=['10', '11', '12'],
    seg_cell_id="cell_ID",
)
/home/nr57/.conda/envs/genomics/lib/python3.11/site-packages/squidpy/pl/_spatial_utils.py:483: FutureWarning: The default value of 'ignore' for the `na_action` parameter in pandas.Categorical.map is deprecated and will be changed to 'None' in a future version. Please set na_action to the desired value to avoid seeing this warning
  color_vector = color_source_vector.map(color_map)
8. Differential expression between domains
[13]:
# Carry the domain labels back to the original score AnnData
neighborhood_scores.obs['leiden'] = neighbscore_copy.obs['leiden']
neighborhood_scores.uns = neighbscore_copy.uns
# One-vs-rest Wilcoxon ranking of ligand-target pairs per domain
sc.tl.rank_genes_groups(neighborhood_scores, "leiden", method="wilcoxon")
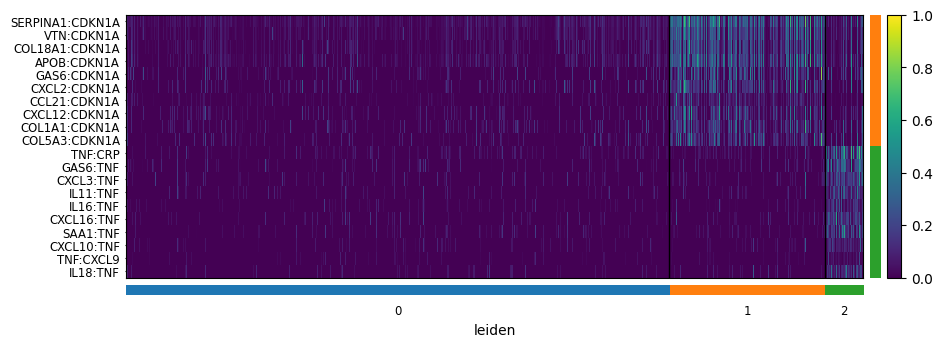
# Heatmap of the top-10 pairs per domain
sc.pl.rank_genes_groups_heatmap(
neighborhood_scores,
n_genes=10,
groupby="leiden",
show_gene_labels=True,
min_logfoldchange=0.5,
dendrogram=False,
swap_axes=True,
standard_scale='var',
cmap='viridis',
)
WARNING: No genes found for group 0
9. Pathway activity in space
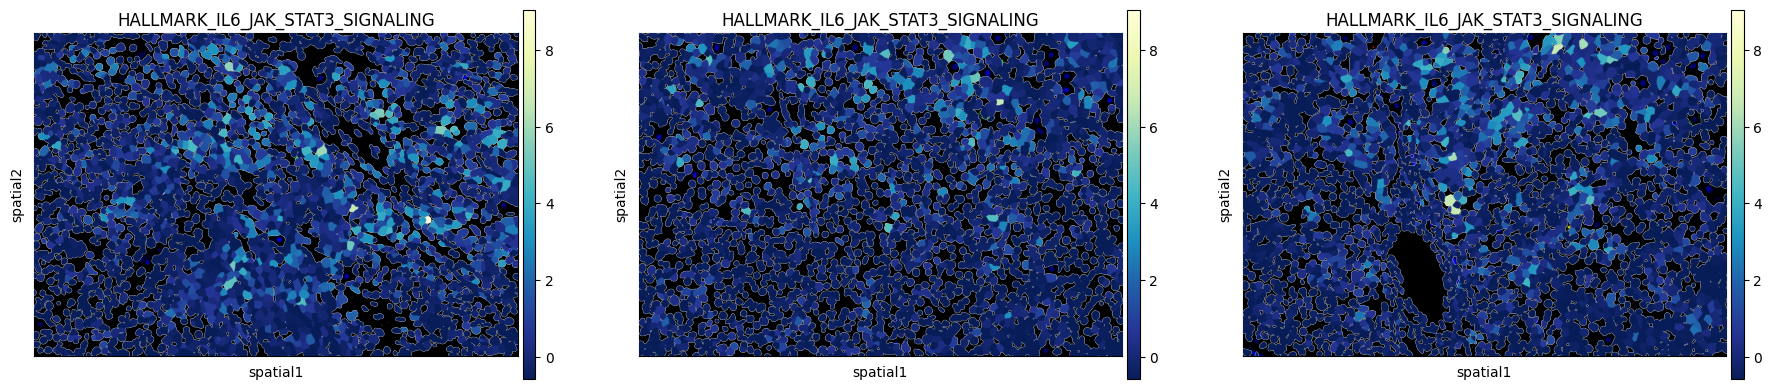
The pcs AnnData returned earlier holds a per-cell activity score for every pathway cluster. Painting one of these onto the tissue is often more interpretable than a single ligand–target pair, because it summarizes a whole biological program.
Below we visualize HALLMARK_IL6_JAK_STAT3_SIGNALING — a canonical inflammatory pathway and the larger context for the IL6:PTGS2 pair we plotted earlier. Bright regions = areas where IL6/JAK/STAT3 signaling activity is predicted from the neighborhood.
[15]:
sq.pl.spatial_segment(
    pcs,
    color='HALLMARK_IL6_JAK_STAT3_SIGNALING',
    library_key="fov",
    library_id=['10', '11', '12'],
    seg_cell_id="cell_ID",
    cmap='YlGnBu_r',
)
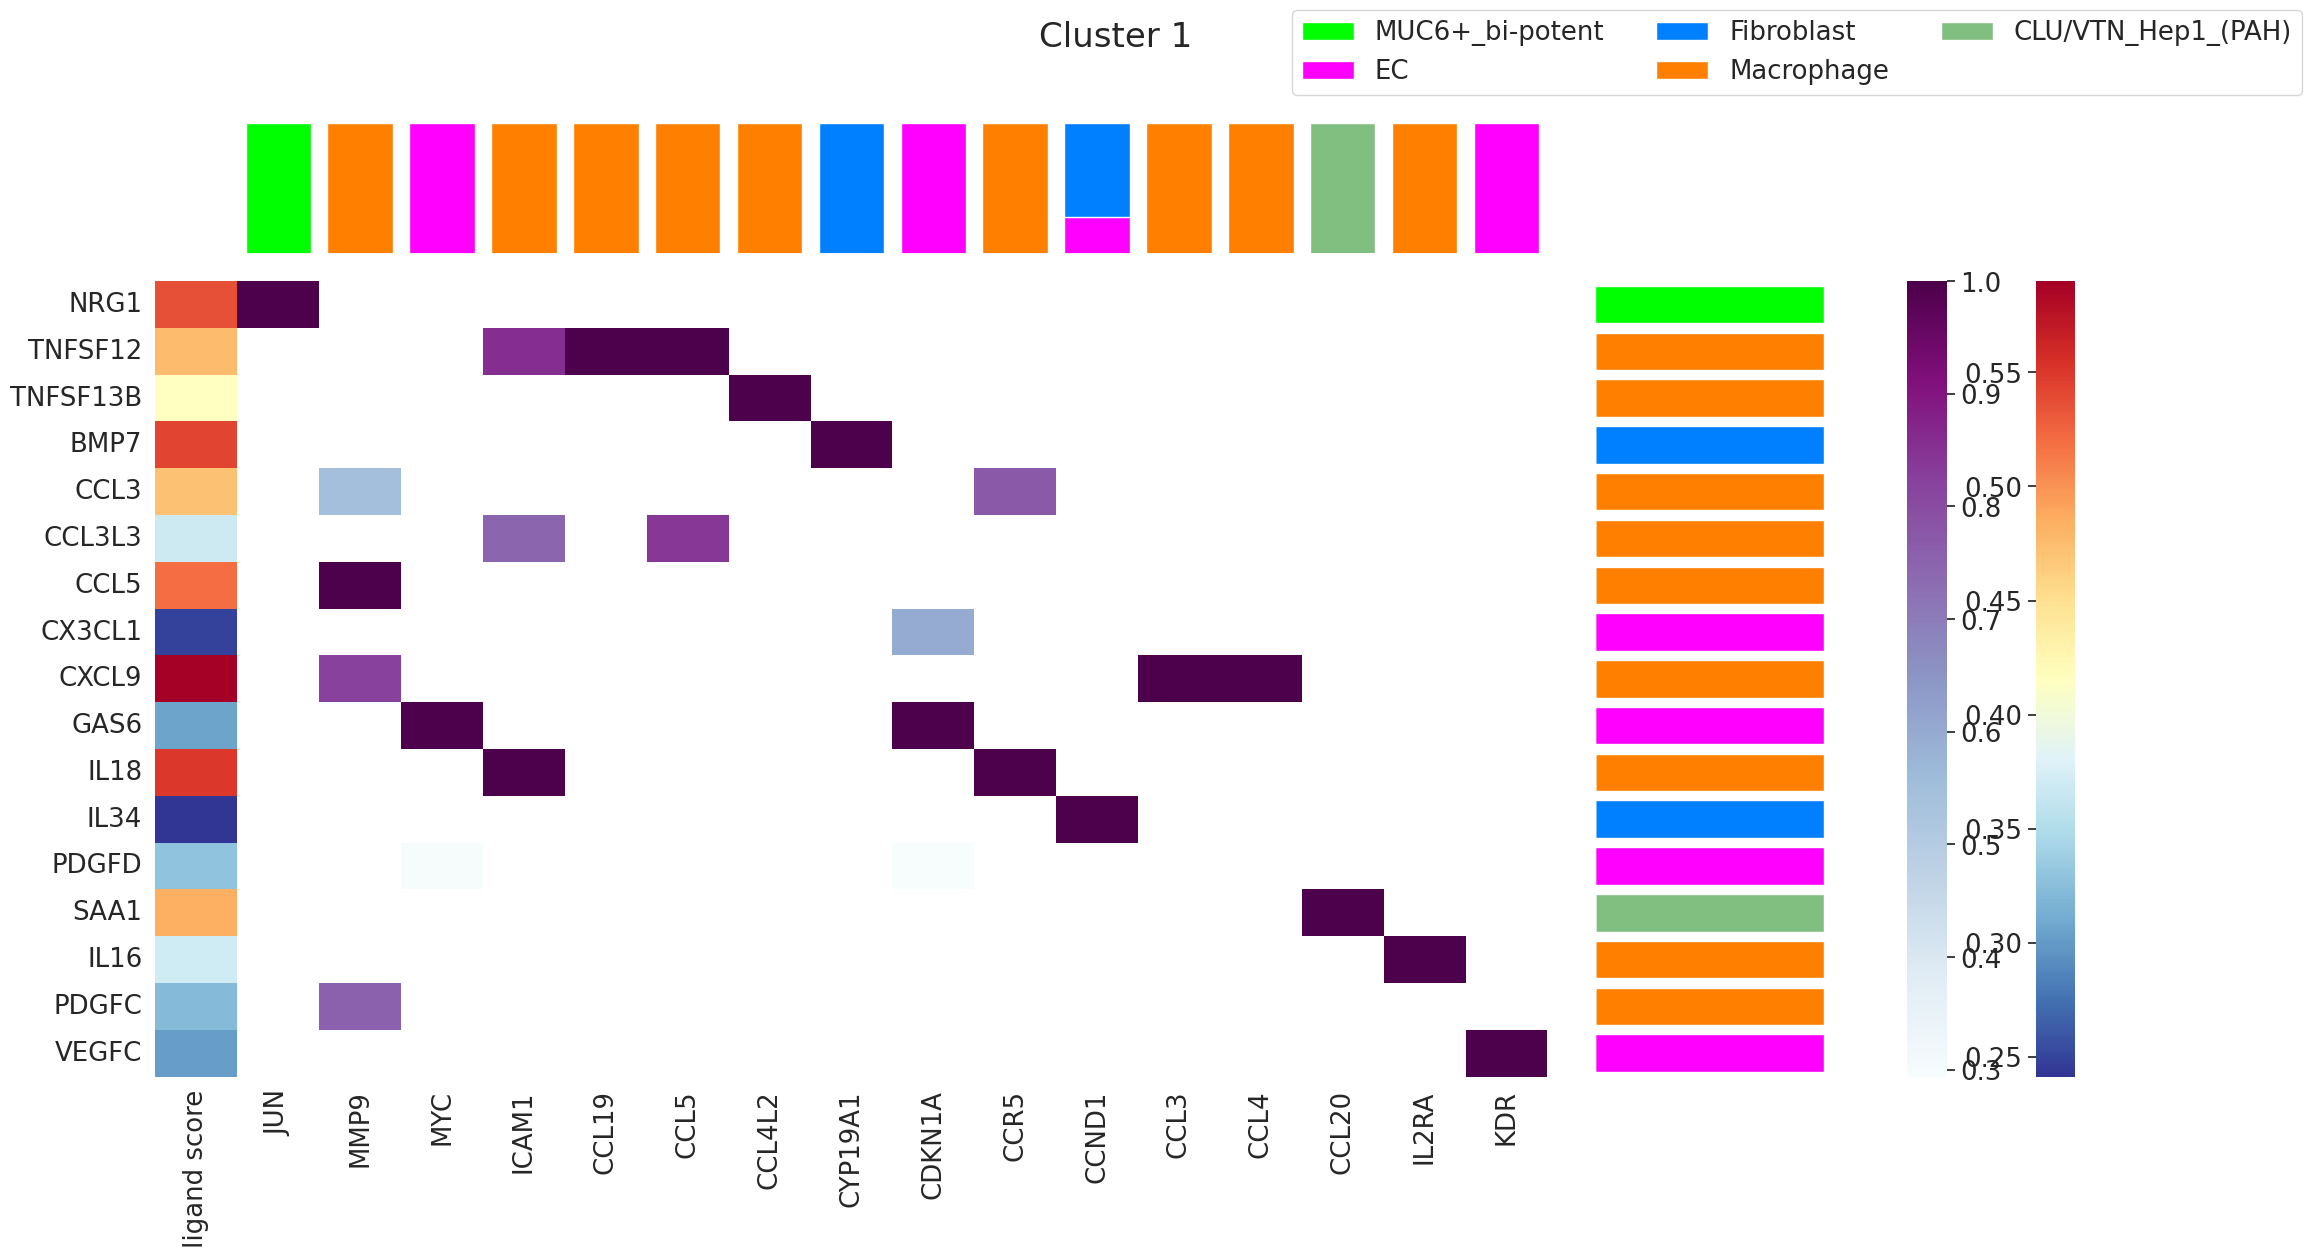
10. Ligand ranking analysis
Inputs needed
celltype— AnnData with cell-type annotations (used to know which cell types are in the domain).ligand_receptor_pairs— curated L–R table (here, from NATMI).ligand_target_regulatory_potential— a precomputed pickle of ligand → top-500 target regulatory scores.The original single-cell AnnData
SC— for measuring receptor expression.
[28]:
# Load the supporting tables for ligand ranking
celltype = sc.read_h5ad('/path/to/celltype.h5ad')
ligand_receptor_pairs = pd.read_csv('/path/to/NATMI_ligand_receptor_pairs.csv')
ligand_target_regulatory_potential = pkl.load(
    open('/path/to/top_500_target_opt_both_scores.pkl', 'rb')
)
SC = sc.read_h5ad('/path/to/cell_level.h5ad')

# Stash the current score matrix so ligand_ranking can reach the raw values
neighborhood_scores.raw = neighborhood_scores.copy()
arguments below:
'1'— rank ligands for communication domain 1 (change to whichever domain you’re investigating).receptor_exp=0.05— keep only ligands whose receptor is expressed in at least 5% of cells in the domain. Filters out ligands the domain literally can’t sense.markers={'top': 100}— use the top 100 marker ligand–target pairs of the domain to score each ligand.domain_celltypes=['top', 5]— restrict the analysis to the top 5 cell types by abundance in the domain.
The output is a multi-panel figure: ligand ranking, expressing cell types, and the spatial location of the domain.
[29]:
fig = Renoir.ligand_ranking(
    neighborhood_scores,
    celltype,
    SC,
    ligand_receptor_pairs,
    ligand_target_regulatory_potential,
    '1',                        # target domain ID
    receptor_exp=0.05,          # min receptor-expressing fraction
    markers={'top': 100},       # top-100 marker pairs as the ranking signal
    domain_celltypes=['top', 5],# restrict to top-5 cell types in the domain
)
fig.set_size_inches(24, 12)
fig
WARNING: It seems you use rank_genes_groups on the raw count data. Please logarithmize your data before calling rank_genes_groups.
/home/nr57/.conda/envs/genomics/lib/python3.11/site-packages/numpy/lib/function_base.py:2853: RuntimeWarning: invalid value encountered in divide
  c /= stddev[:, None]
/home/nr57/.conda/envs/genomics/lib/python3.11/site-packages/numpy/lib/function_base.py:2854: RuntimeWarning: invalid value encountered in divide
  c /= stddev[None, :]
/home/nr57/.conda/envs/genomics/lib/python3.11/site-packages/Renoir/downstream.py:881: FutureWarning: Setting an item of incompatible dtype is deprecated and will raise an error in a future version of pandas. Value '0.06160303276468995' has dtype incompatible with int64, please explicitly cast to a compatible dtype first.
  ct_bar_plot.loc[row,col] = celltype_avg[domain][col]
/home/nr57/.conda/envs/genomics/lib/python3.11/site-packages/Renoir/downstream.py:881: FutureWarning: Setting an item of incompatible dtype is deprecated and will raise an error in a future version of pandas. Value '0.06248307608989981' has dtype incompatible with int64, please explicitly cast to a compatible dtype first.
  ct_bar_plot.loc[row,col] = celltype_avg[domain][col]
/home/nr57/.conda/envs/genomics/lib/python3.11/site-packages/Renoir/downstream.py:881: FutureWarning: Setting an item of incompatible dtype is deprecated and will raise an error in a future version of pandas. Value '0.15766314649336582' has dtype incompatible with int64, please explicitly cast to a compatible dtype first.
  ct_bar_plot.loc[row,col] = celltype_avg[domain][col]
/home/nr57/.conda/envs/genomics/lib/python3.11/site-packages/Renoir/downstream.py:881: FutureWarning: Setting an item of incompatible dtype is deprecated and will raise an error in a future version of pandas. Value '0.062144597887896016' has dtype incompatible with int64, please explicitly cast to a compatible dtype first.
  ct_bar_plot.loc[row,col] = celltype_avg[domain][col]
/home/nr57/.conda/envs/genomics/lib/python3.11/site-packages/Renoir/downstream.py:881: FutureWarning: Setting an item of incompatible dtype is deprecated and will raise an error in a future version of pandas. Value '0.21385052802599513' has dtype incompatible with int64, please explicitly cast to a compatible dtype first.
  ct_bar_plot.loc[row,col] = celltype_avg[domain][col]
/home/nr57/.conda/envs/genomics/lib/python3.11/site-packages/Renoir/downstream.py:894: FutureWarning: Setting an item of incompatible dtype is deprecated and will raise an error in a future version of pandas. Value '0.06160303276468995' has dtype incompatible with int64, please explicitly cast to a compatible dtype first.
  ct_bar_plot.loc[row,col] = celltype_avg[domain][col]
/home/nr57/.conda/envs/genomics/lib/python3.11/site-packages/Renoir/downstream.py:894: FutureWarning: Setting an item of incompatible dtype is deprecated and will raise an error in a future version of pandas. Value '0.06248307608989981' has dtype incompatible with int64, please explicitly cast to a compatible dtype first.
  ct_bar_plot.loc[row,col] = celltype_avg[domain][col]
/home/nr57/.conda/envs/genomics/lib/python3.11/site-packages/Renoir/downstream.py:894: FutureWarning: Setting an item of incompatible dtype is deprecated and will raise an error in a future version of pandas. Value '0.15766314649336582' has dtype incompatible with int64, please explicitly cast to a compatible dtype first.
  ct_bar_plot.loc[row,col] = celltype_avg[domain][col]
/home/nr57/.conda/envs/genomics/lib/python3.11/site-packages/Renoir/downstream.py:894: FutureWarning: Setting an item of incompatible dtype is deprecated and will raise an error in a future version of pandas. Value '0.062144597887896016' has dtype incompatible with int64, please explicitly cast to a compatible dtype first.
  ct_bar_plot.loc[row,col] = celltype_avg[domain][col]
/home/nr57/.conda/envs/genomics/lib/python3.11/site-packages/Renoir/downstream.py:894: FutureWarning: Setting an item of incompatible dtype is deprecated and will raise an error in a future version of pandas. Value '0.21385052802599513' has dtype incompatible with int64, please explicitly cast to a compatible dtype first.
  ct_bar_plot.loc[row,col] = celltype_avg[domain][col]
[29]: